source-library
CLIMATE & POLLUTION
Rising Temperatures
Rising Temperatures
Puts thousands of species and their ecosystems at risk
- World Wildlife Fund 17
- Greatest cause of species extinctions this century
- 1.5°C average rise may put 20-30% of species at risk of extinction (IPCC)
- If the planet warms by more than 2°C, most ecosystems will struggle. (IPCC)
- NASA
- Rising Temperatures show a continuous trend

- Rising Temperatures show a continuous trend
- Diffenbaugh 13 (cited)
- ‘Not only is the planet undergoing one of the largest climate changes in the past 65 million years, scientists report that it’s occurring at a rate 10 times faster than any change in that period. Without intervention, this extreme pace could lead to a 5-6 degree Celsius spike in annual temperatures by the end of the century. ‘
- 65 million years ago was the Cretaceous-Paleogene extinction, when the dinosaurs went extinct and according to National Geographic, where 76% of the world’s species went extinct
- Mora et al. 17
- Looks at the amount of people who will exposed to dangerous heat as a result of climate change
- ‘Based on the climatic conditions of those lethal heat events, we identified a global threshold beyond which daily mean surface air temperature and relative humidity become deadly.’
- ‘Around 30% of the world’s population is currently exposed to climatic conditions exceeding this deadly threshold for at least 20 days a year. By 2100, this percentage is projected to increase to ∼48% under a scenario with drastic reductions of greenhouse gas emissions and ∼74% under a scenario of growing emissions.’
- ‘An increasing threat to human life from excess heat now seems almost inevitable, but will be greatly aggravated if greenhouse gases are not considerably reduced.’
- Hausfather et al. 19 (cited)
- ‘The team compared 17 increasingly sophisticated model projections of global average temperature developed between 1970 and 2007, including some originally developed by NASA, with actual changes in global temperature observed through the end of 2017.’
- ‘The results: 10 of the model projections closely matched observations. Moreover, after accounting for differences between modeled and actual changes in atmospheric carbon dioxide and other factors that drive climate, the number increased to 14. The authors found no evidence that the climate models evaluated either systematically overestimated or underestimated warming over the period of their projections.’
Rising CO2 Emissions
Rising CO2 Emissions
- CDP Carbon Majors Report 17 (cited)
- Just 100 fossil fuel-producing companies are responsible for 71% of global emissions
- UPI: Roach 20
- CO2 emissions are reaching record highs even among the COVID-19 pandemic
Ice Loss
Ice Loss
Occurs rapidly on both poles
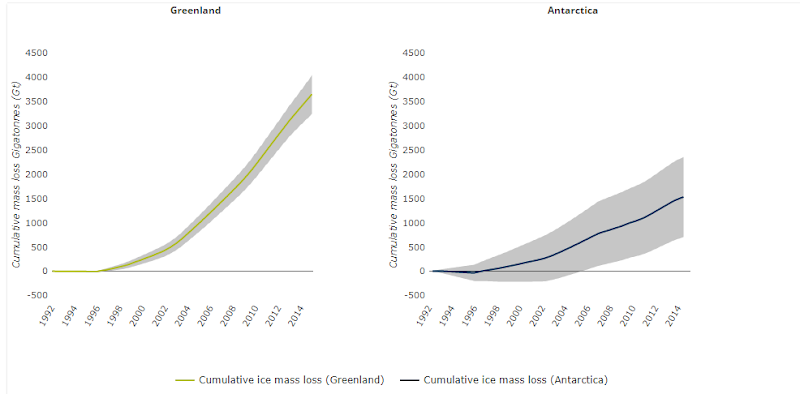
- European Environmental Agency 16
- Greenland Ice Loss from 1992 to 2015 was 3,600 Gigatonnes (3,500,000,000,000,000 Kilograms)
- Contributed to global sea level rise by approximately 10 mm;
- Antarctica loss is 1,500 Gigatonnes (1,500,000,000,000,000 Kilograms)
- Corresponds to approximately a 5 mm global sea level rise since 1992.
- Model projections suggest further declines of the polar ice sheets in the future, but the uncertainties are large.
- The melting of the polar ice sheets is estimated to contribute up to 50 cm of global sea level rise during the 21st century.
Impact of Climate Change
Impact of Climate Change
Climate change causes floods, exacerbates natural disasters, and puts homes underwater
Sea Level and Flooding
- National Ocean Service
- Why Climate change effects sea levels
- oceans warm due to an increasing global temperature, causing seawater to expand and take up more space in the ocean basin and causing a rise in water level.
- melting of ice over land, which adds water to the ocean.
- Why Climate change effects sea levels
- National Oceanic and Atmospheric Administration: Lindsey 18
- “The rising water level is mostly due to a combination of meltwater from glaciers and ice sheets and thermal expansion of seawater as it warms.”
- Scope: In the United States, almost 40 percent of the population lives in relatively high population-density coastal areas, where sea level plays a role in flooding, shoreline erosion, and hazards from storms.
- Globally, 8 of the world’s 10 largest cities are near a coast, according to the U.N. Atlas of the Oceans.
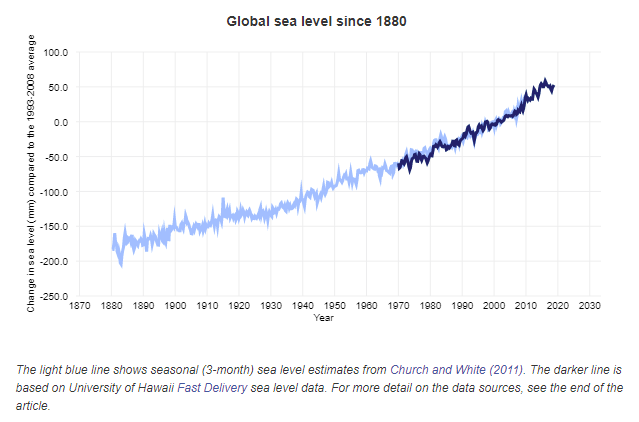
- Sea levels have been continuously rising and put these areas under threat:
- Climate Central Executive Report: Strauss et al. 12
- Climate change sea level impact
- raised sea level about eight inches since 1880
- the rate of rise is accelerating
- Scientists expect 20 to 80 more inches this century, a lot depending upon how much more heat-trapping pollution humanity puts into the sky
- This study makes mid-range projections of 1 to 8 inches by 2030, and 4 to 19 inches by 2050, depending upon location across the contiguous 48 states.
- Climate change flooding impact
- Rising seas dramatically increase the odds of damaging floods from storm surges.
- For more than two-thirds of the locations analyzed (and for 85% of sites outside the Gulf of Mexico), past and future global warming more than doubles the estimated odds of “century” or worse floods occurring within the next 18 years
- Impact on homes
- At three quarters of the 55 sites analyzed, century levels are higher than 4 feet above the high tide line.
- Across the country nearly 5 million people live in 2.6 million homes at less than 4 feet above high tide.
- In 285 cities and towns, more than half the population lives on land below this line, potential victims of increasingly likely climate-induced coastal flooding.
- 3.7 million live less than 1 meter above the tide.
- About half of this exposed population, and eight of the top 10 cities, are in the state of Florida. About $30 billion in taxable property is vulnerable below the three-foot line in just three counties in southeast Florida.
- Climate change sea level impact
- Kulp 19 (cited)
- ‘200 million people in the world will live below the sea level line by 2100. An additional 160 million will be affected by higher annual flooding due to rising ocean levels.’
- Only pressumes a 2 degree rise
- Clark et al. 18
- ‘The authors make a case for using carbon emissions and commensurate sea level rise as an additional guide for future policy decisions on limiting carbon emissions, much like the Paris Agreement did based on the carbon dioxide (CO2)-temperature relationship.’
- ‘The researchers say that keeping sea level rise to 3-9 meters – or roughly 10 to 30 feet – over several thousand years is likely too optimistic unless society finds ways to quickly reach zero emissions and lower the CO2 in the atmosphere. If cumulative CO2 emissions rise to 3,000 billion tons, it likely will result in sea level rise of between 30 and 40 meters, the study shows.’
Wildfires
- Jones et al. 20
- ‘In light of the Australian fires, scientists from the University of East Anglia (UEA), Met Office Hadley Centre, University of Exeter and Imperial College London have conducted a Rapid Response Review of 57 peer-reviewed papers published since the IPCC’s Fifth Assessment Report in 2013.’
- ‘Observational data shows that fire weather seasons have lengthened across approximately 25 per cent of the Earth’s vegetated surface, resulting in about a 20 per cent increase in global mean length of the fire weather season.’
- Westerling et al. 06
- ‘Documentary records and proxy reconstructions (primarily from tree rings) of fire history and climate provide evidence that western forest wildfire risks are strongly positively associated with drought concurrent with the summer fire season’
- ‘The greatest increases occurred in mid-elevation, Northern Rockies forests, where land-use histories have relatively little effect on fire risks and are strongly associated with increased spring and summer temperatures and an earlier spring snowmelt.’
- Flannigan et al. 05
- ‘On average, area burned in Canada is projected to increase by 74–118% by the end of this century in a 3 × CO2 scenario. These estimates do not explicitly take into account any changes in vegetation, ignitions, fire season length, and human activity (fire management and land use activities) that may influence area burned. However, the estimated increases in area burned would have significant ecological, economic and social impacts for Canada.’
- Gross et al. 20
- ‘We report a substantial and statistically significant historical trend toward autumns which are increasingly conducive to enhanced wildfire risk across most of California’
- ‘We show that state-wide increases in autumn temperature (~1 ◦C) and decreases in autumn precipitation (~30%) over the past four decades have contributed to increases in aggregate fire weather indices (+20%)’
- Image below shows the number of days where FWI (a measurement of fire potential) in September to November exceeds 95% of the FWI during the before mentioned timeframe from 1979-2018 using two models, the one on the left being reaching Paris climate agreement targets, and the one on the right being based on current emissions

- Abatzoglou et al. 16*
- ‘We estimate that human-caused climate change contributed to an additional 4.2 million ha of forest fire area during 1984–2015, nearly doubling the forest fire area expected in its absence. Natural climate variability will continue to alternate between modulating and compounding anthropogenic increases in fuel aridity’
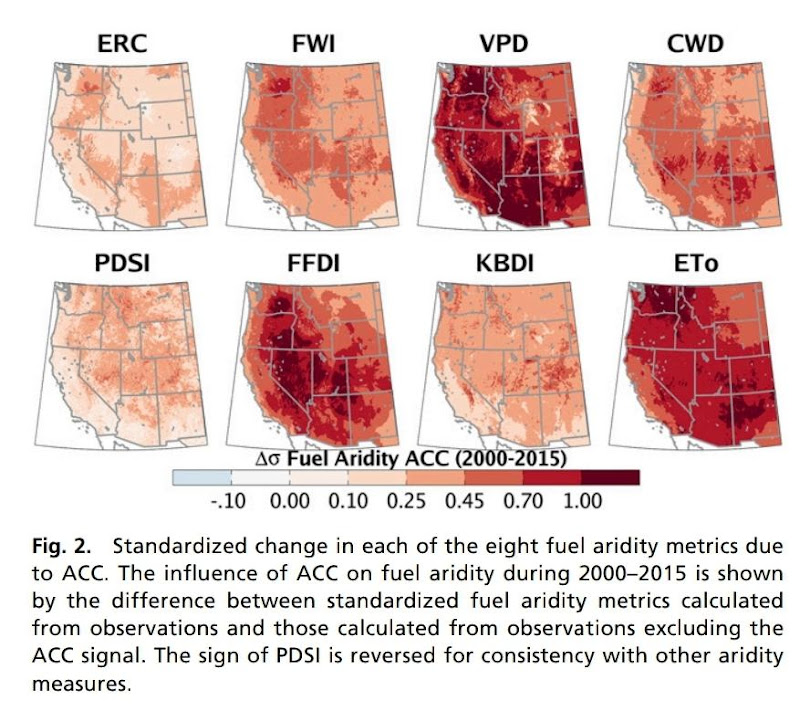
- ‘We estimate that human-caused climate change contributed to an additional 4.2 million ha of forest fire area during 1984–2015, nearly doubling the forest fire area expected in its absence. Natural climate variability will continue to alternate between modulating and compounding anthropogenic increases in fuel aridity’
- Stevens‐Rumann et al. 18
- ‘We used a multi‐regional dataset of 1485 sites across 52 wildfires from the US Rocky Mountains to ask if and how changing climate over the last several decades impacted post‐fire tree regeneration, a key indicator of forest resilience.’
- ‘Results highlight significant decreases in tree regeneration in the 21st century. Annual moisture deficits were significantly greater from 2000 to 2015 as compared to 1985–1999, suggesting increasingly unfavourable post‐fire growing conditions, corresponding to significantly lower seedling densities and increased regeneration failure.’
- Pechony & Shindell 10
- ‘We find that during the preindustrial period, the global fire regime was strongly driven by precipitation (rather than temperature), shifting to an anthropogenic-driven regime with the Industrial Revolution. Our future projections indicate an impending shift to a temperature-driven global fire regime in the 21st century, creating an unprecedentedly fire-prone environment. These results suggest a possibility that in the future climate will play a considerably stronger role in driving global fire trends, outweighing direct human influence on fire (both ignition and suppression), a reversal from the situation during the last two centuries.’
- Dowdy et al. 19
- ‘The projections show a clear trend towards more dangerous near-surface fire weather conditions for Australia based on the FFDI [McArthur Forest Fire Danger Index], as well as increased pyroconvection risk factors for some regions of southern Australia based on the CH [Continuous Haines index].’
- Virgilio et al. 19
- ‘Statistically significant increases in the number of days where both C‐Haines [atmospheric instability and dryness] and near‐surface fire weather values are conducive to pyroCb [pyrocumulonimbus wildfires, extremely dangerous wildfires] development are projected across southeastern Australia’
- Shvidenko & Schepaschenko 13
- Looks at forests in Russia
- ‘The forecasts that are based on Global Circulation Models suppose the dramatic acceleration of the fire regimes by the end of the 21st century. Taking into account the predicted increase of dryness of future climates and thawing of permafrost, this will likely lead to the dramatic loss of forested area and impoverishment of the forest cover over a major part of the forest zone.’
- Turco et al. 18
- ‘Here, we estimate future summer burned area in Mediterranean Europe under 1.5, 2, and 3 °C global warming scenarios, accounting for possible modifications of climate-fire relationships under changed climatic conditions owing to productivity alterations.’
- ‘The higher the warming level is, the larger is the increase of burned area, ranging from ~40% to ~100% across the scenarios. Our results indicate that significant benefits would be obtained if warming were limited to well below 2 °C.’
- Image below shows mean % change of burned area between two models, the stationary model and the non stationary model

- Bowman et al. 17
- ‘Climate change projections suggest an increase in days conducive to extreme wildfire events by 20 to 50% in these disaster-prone landscapes, with sharper increases in the subtropical Southern Hemisphere and European Mediterranean Basin.’
- Drobyshev 19
- ‘The 3 large-ensembles with climate models on the other hand point to a roughly 1.1 times increased risk for such events in the current climate relative to pre-industrial climate. For a future climate (2C warming) we find a roughly 2 times increased risk for such events relative to pre-industrial climate. The increased fire weather risk is mainly attributed to the increase in temperature. The other main factor, precipitation during summer months, is projected to increase for Northern Sweden, and decrease for Southern Sweden.’
- Groot et al. 13
- ‘2091–2100 fire regimes were simulated in central Russia and western Canada. Relative changes to monthly temperature, precipitation, relative humidity and wind speed, from three global climate models and three climate change scenarios, were superimposed on contemporary daily values to estimate future fire severity. All models and climate change scenarios indicate that future fire weather conditions will become more severe, and fire control more difficult, in both boreal regions.’
- ‘Some climate change scenarios indicated Daily Severity Rating increases of 400–500%’
- Fargeon et al. 20
- ‘This study identifies increasingly fire-prone conditions throughout France during the 21st century, using FWI and other metrics, resulting from EURO-CORDEX GCM and RCM outputs, using both RCP4.5 and RCP8.5. Largest increases were seen in the Mediterranean region of France. The study projects FWI begins to be distinguished from natural variability after 2060 but only for RCP8.5. Summer elevated fire danger projected three times more likely for warming anomalies of +2C.’
- Nature 20
- Nature article on peat lands and climate change
- ‘Peatlands are carbon-rich soils that accumulate as waterlogged plants slowly decay, sometimes over thousands of years. They are the most carbon-dense ecosystems on Earth; a typical northern peatland packs in roughly ten times as much carbon as a boreal forest. When peat burns, it releases its ancient carbon to the atmosphere, adding to the heat-trapping gases that cause climate change.’
- ‘It’s a feedback loop: as peatlands release more carbon, global warming increases, which thaws more peat and causes more wildfires (see ‘Peatlands burning’). A study published last month shows that northern peatlands could eventually shift from being a net sink for carbon to a net source of carbon, further accelerating climate change.’
Droughts
- NASA 16
- Talks about a drought in the Eastern Mediterranean, which has been found to be the worst to hit the area in at least 900 years
- ‘”If we look at recent events and we start to see anomalies that are outside this range of natural variability, then we can say with some confidence that it looks like this particular event or this series of events had some kind of human caused climate change contribution,” he [Ben Cook] said’
- ‘”The Mediterranean is one of the areas that is unanimously projected [in climate models] as going to dry in the future [due to man-made climate change],” said Yochanan Kushnir, a climate scientist at Lamont Doherty Earth Observatory, who was not involved in the research. “This paper shows that the behavior during this recent drought period is different than what we see in the rest of the record,” he said, which means that the Levant region may already be feeling the affects of human-induced warming of the planet.’
- McCabe et al. 17
- Looks specifically at the Upper Colorado River Flows
- ‘It is expected that as warming continues, the negative effects of temperature on water-year UCRB streamflow will become more evident and problematic.’
- Van Dijk et al. 13
- Looks at the ‘Millennium Drought,’ the worst drought on record for southeast Australia.
- ‘Combined with the multiple dimensions of multiyear droughts and the specter of climate change, this means future droughts may well break records in ever new ways and not necessarily be managed better than past ones.’
- Cook et al. 15
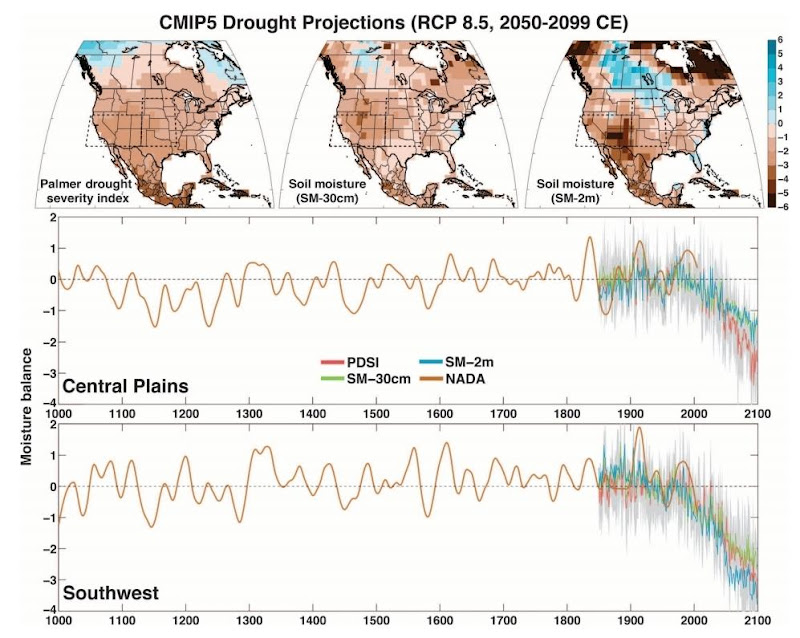
- Looks at the American Southwest and Central Plains
- ‘We use an empirical drought reconstruction and three soil moisture metrics from 17 state-of-the-art general circulation models to show that these models project significantly drier conditions in the later half of the 21st century compared to the 20th century and earlier paleoclimatic intervals.This desiccation is consistent across most of the models and moisture balance variables, indicating a coherent and robust drying response to warming despite the diversity of models and metrics analyzed.’
- ‘Notably, future drought risk will likely exceed even the driest centuries of the Medieval Climate Anomaly (1100–1300CE) in both moderate (RCP 4.5) and high (RCP 8.5) future emissions scenarios, leading to unprecedented drought conditions during the last millennium.’
- Marvel et al. 19 (cited)
- ‘Human-generated greenhouse gases and atmospheric particles were affecting global drought risk as far back as the early 20th century, according to a new study.’
- ‘Climate models predict that a human “fingerprint” – a global pattern of regional drying and wetting characteristic of the climate response to greenhouse gases – should be visible early in the 1900’s and increase over time as emissions increased. Using observational data such as precipitation and historical data reconstructed from tree rings, the researchers found that the real-world data began to align with the fingerprint within the first half of the 20th century.’
- Komuscu et al. 98
- Looks at soil moisture levels in the Southeast Anatolia Development Project Region in Turkey
- ‘Particularly southern and southeastern parts of the region will suffer severe moisture shortages during summer. Winter surplus decreased in scenarios with increased temperature and decreased precipitation in most cases. Even when precipitation was not changed, total annual surplus decreased by 4 percent to 43 percent for a 2 • C warming and by 8 percent to 91 percent for a 4 • C warming.’
- Kelley et al. 15
- ‘Precipitation changes in Syria are linked to rising mean sea-level pressure in the Eastern Mediterranean, which also shows a long-term trend. There has been also a long-term warming trend in the Eastern Mediterranean, adding to the drawdown of soil moisture.’
- ‘No natural cause is apparent for these trends, whereas the observed drying and warming are consistent with model studies of the response to increases in greenhouse gases.’
- Furthermore, model studies show an increasingly drier and hotter future mean climate for the Eastern Mediterranean. Analyses of observations and model simulations indicate that a drought of the severity and duration of the recent Syrian drought, which is implicated in the current conflict, has become more than twice as likely as a consequence of human interference in the climate system.’
- Caplan et al. 19 (cited)
- ‘During a 25-year experiment in Kansas that involved irrigation of prairie soil with sprinklers, a Rutgers-led team of scientists found that a 35 percent increase in rainfall led to a 21 percent to 33 percent reduction in water infiltration rates in soil and only a small increase in water retention.’
Ocean Acidification
- Jacobson 05
- ‘Whereas surface ocean pH is estimated to have dropped from near 8.25 to near 8.14 between 1751 and 2004, it is forecasted to decrease to near 7.85 in 2100 under the SRES A1B emission scenario, for a factor of 2.5 increase in H+ in 2100 relative to 1751.’
- Ridgwell et al. 10 (cited)
- ‘A new model, capable of assessing the rate at which the oceans are acidifying, suggests that changes in the carbonate chemistry of the deep ocean may exceed anything seen in the past 65 million years.’
- ‘Dr Andy Ridgwell, lead author on the paper, said: “Unlike surface plankton dwelling in a variable habitat, organisms living deep down on the ocean floor are adapted to much more stable conditions. A rapid and severe geochemical change in their environment would make their survival precarious.”’
- ‘“The widespread extinction of these ocean floor organisms during the Paleocene-Eocene greenhouse warming and acidification event tells us that similar extinctions in the future are possible.”’
- Hönisch et al. 12
- This one goes beyond what the previous article said and suggests nothing compares up to 300 million years ago
- ‘We review events exhibiting evidence for elevated atmospheric CO2, global warming, and ocean acidification over the past ~300 million years of Earth’s history, some with contemporaneous extinction or evolutionary turnover among marine calcifiers. Although similarities exist, no past event perfectly parallels future projections in terms of disrupting the balance of ocean carbonate chemistry—a consequence of the unprecedented rapidity of CO2 release currently taking place.’
- National Research Council 13 (cited)
- ‘Decreasing shellfish populations would harm the entire ocean food chain, researchers say, particularly affecting people who get their protein or paycheck from the sea. Globally, fish represent about 6 percent of the protein people eat.’
- ‘The panel cited the Pacific Northwest as an economic example, where high acidity levels have hampered oyster hatcheries, worth about $270 million and 3,200 jobs to coastal communities there. It is unclear if ocean acidification is the culprit, but it could be a harbinger of things to come, according to the report.’
Food Shortages
- NYT 19
- Talks about a UN report, specifically focussing on food shortages
- ‘The report, prepared by more than 100 experts from 52 countries and released in summary form in Geneva on Thursday, found that the window to address the threat is closing rapidly. A half-billion people already live in places turning into desert, and soil is being lost between 10 and 100 times faster than it is forming, according to the report.‘
- ‘“Above 2 degrees of global warming there could be an increase of 100 million or more of the population at risk of hunger,” Edouard Davin, a researcher at ETH Zurich and an author of the report, said by email. “We need to act quickly.”’
- Scheelbeek et al. 18
- ‘A 4 °C increase in temperature reduced mean yields by −31.5% (−41.4% to −21.5%). Impacts of environmental changes on nutritional quality were mixed. In a business-as-usual scenario, predicted changes in environmental exposures would lead to reductions in yields of nonstaple vegetables and legumes.’
- ‘Where adaptation possibilities are limited, this may substantially change their global availability, affordability, and consumption in the mid to long term. Our results stress the importance of prioritizing agricultural developments, to minimize potential reductions in vegetable and legume yields and associated negative health effects.’
- Tigchelaar et al. 18
- ‘For the top four maize-exporting countries, which account for 87% of global maize exports, the probability that they have simultaneous production losses greater than 10% in any given year is presently virtually zero, but it increases to 7% under 2 °C warming and 86% under 4 °C warming. Our results portend rising instability in global grain trade and international grain prices, affecting especially the ∼800 million people living in extreme poverty who are most vulnerable to food price spikes. ‘
- Deryng et al. 11
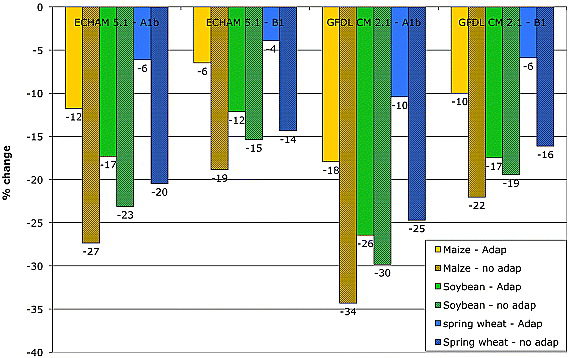
- ‘Soybean yield decreases by 15 to 30% without adaptation. However, soybean experiences the larger global decrease in yield for simulations allowing adaptation: 12 to 26%, while maize yield decreases by 6 to 18%. Overall, adapting planting date and cultivar choice show a stronger impact in the case of maize and spring wheat, resulting in an average reduction in global crop yield losses by 18 and 12%, respectively, whereas it shows a lesser effect in the case of soybean with an average reduction in global crop yield losses of only 7%.’
- So even with adaptation, we would still have fairly significant losses
- Battisti et al. 09
- ‘Experimental and crop-based models for major grains in these regions show direct yield losses in the range of 2.5 to 16% for every 1°C increase in seasonal temperature. Large additional losses are expected from sea level rise and decreased soil moisture caused by higher average temperatures. Despite the general perception that agriculture in temperate latitudes will benefit from increased seasonal heat and supply food to deficit areas, even mid-latitude crops will likely suffer at very high temperatures in the absence of adaptation. Global climate change thus presents widespread risks of food insecurity.’
- Peng et al. 04
- ‘Grain yield declined by 10% for each 1°C increase in growing-season minimum temperature in the dry season’
- ‘This report provides a direct evidence of decreased rice yields from increased nighttime temperature associated with global warming.’
- Schlenker et al. 10
- Looks specifically at Africa
- ‘By mid-century, the mean estimates of aggregate production changes in SSA [sub saharan Africa] our preferred model specification are − 22, − 17, − 17, − 18, and − 8% for maize, sorghum, millet, groundnut, and cassava, respectively. In all cases except cassava, there is a 95% probability that damages exceed 7%, and a 5% probability that they exceed 27%. Moreover, countries with the highest average yields have the largest projected yield losses, suggesting that well-fertilized modern seed varieties are more susceptible to heat related losses.’
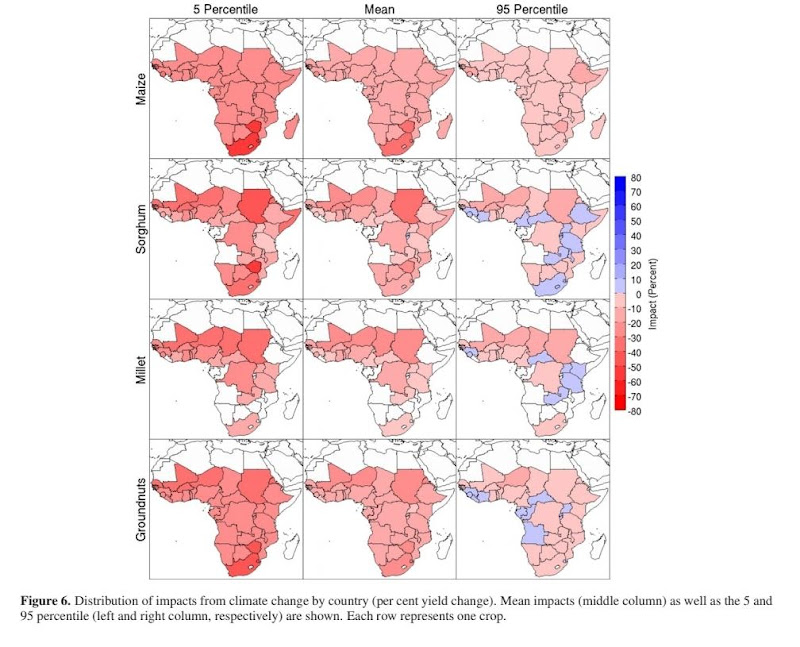
- Scheelbeek et al. 18
- ‘In papers with baseline temperatures >20 °C, a 4 °C increase in temperature reduced mean yields by −31.5% (−41.4% to −21.5%).’
- Williams et al. 07
- Uses two scenarios, A2 and B1
- According to Wikipedia, here is what this means:
- The A2 scenarios are of a more divided world. The A2 family of scenarios is characterized by:
- A world of independently operating, self-reliant nations.
- Continuously increasing population.
- Regionally oriented economic development.
- Low emissions
- The B1 scenarios are of a world more integrated, and more ecologically friendly. The B1 scenarios are characterized by:
- Rapid economic growth as in A1, but with rapid changes towards a service and information economy.
- Population rising to 9 billion in 2050 and then declining as in A1.
- Reductions in material intensity and the introduction of clean and resource efficient technologies.
- An emphasis on global solutions to economic, social and environmental stability.
- ‘Under the high-end A2 scenario, 12–39% and 10–48% of the Earth’s terrestrial surface may respectively experience novel and disappearing climates by 2100 AD. Corresponding projections for the low-end B1 scenario are 4–20% and 4–20%.’
- Challinor et al. 14 (cited)
- ‘A study led by the University of Leeds has shown that global warming of only 2°C will be detrimental to crops in temperate and tropical regions, with reduced yields from the 2030s onwards.’
- ‘The researchers state that we will see, on average, an increasingly negative impact of climate change on crop yields from the 2030s onwards. The impact will be greatest in the second half of the century, when decreases of over 25% will become increasingly common.‘
- Ray et al. 19
- ‘Our results show that impacts are mostly negative in Europe, Southern Africa and Australia but generally positive in Latin America. Impacts in Asia and Northern and Central America are mixed. This has likely led to ~1% average reduction (-3.5 X 10¹³ kcal/year) in consumable food calories in these ten crops. In nearly half of food insecure countries, estimated caloric availability decreased. Our results suggest that climate change has already affected global food production.’
Hurricanes
- Kossin et al. 20
- ‘Here the homogenized global TC [tropical cyclone] intensity record is extended to the 39-y period 1979–2017, and statistically significant (at the 95% confidence level) increases are identified. Increases and trends are found in the exceedance probability and proportion of major (Saffir−Simpson categories 3 to 5) TC intensities, which is consistent with expectations based on theoretical understanding and trends identified in numerical simulations in warming scenarios.’
- ‘Major TCs pose, by far, the greatest threat to lives and property. Between the early and latter halves of the time period, the major TC exceedance probability increases by about 8% per decade, with a 95% CI of 2 to 15% per decade.’
- Grinstead et al. 19 (cited)
- ‘The authors found that the frequency of the most damaging hurricanes had increased by a rate of 330% per century.’
- ‘“Our data reveal an emergent positive trend in damage which we attribute to a detectable change in extreme storms due to global warming,” they write.’
- Webster et al. 05
- ‘A large increase was seen in the number and proportion of hurricanes reaching categories 4 and 5. The largest increase occurred in the North Pacific, Indian, and Southwest Pacific Oceans, and the smallest percentage increase occurred in the North Atlantic Ocean. These increases have taken place while the number of cyclones and cyclone days has decreased in all basins except the North Atlantic during the past decade.’
- Emanuel 05
- ‘My results suggest that future warming may lead to an upward trend in tropical cyclone destructive potential,and—taking into account an increasing coastal population—a substantial increase in hurricane-related losses in the twenty-first century.’
- Bhatia et al. 19
- ‘Over the 28-year period, the percentage of 24-h intensity changes that exceed an intensification rate of 30 knots approximately triples in IBTrACS and ADT-HURSAT.’
- Patricola et al. 18 (cited)
- ‘Researchers found that if little is done to constrain greenhouse gas emissions and the world warms by 3C to 4C this century then hurricane rainfall could increase by a third, while wind speeds would be boosted by as much as 25 knots.’
- Bender et al. 10
- ‘The model projects nearly a doubling of the frequency of category 4 and 5 storms by the end of the 21st century, despite a decrease in the overall frequency of tropical cyclones, when the downscaling is based on the ensemble mean of 18 global climate-change projections.’
- Risser & Wehner 17
- ‘We find that human‐induced climate change likely increased the chances of the observed precipitation accumulations during Hurricane Harvey in the most affected areas of Houston by a factor of at least 3.5. Further, precipitation accumulations in these areas were likely increased by at least 18.8% (best estimate of 37.7%), which is larger than the 6–7% associated with an attributable warming of 1°C in the Gulf of Mexico and Clausius‐Clapeyron scaling.’
- Kossin 18 (cited)
- Talks about hurricane slowness, which means it spends longer in the areas it hits, therefore causing more damage. Combined with having more powerful hurricanes like I have shown, and this is a very bad situation.
- ‘Storms have slowed by an average of 10%, according to Kossin’s research. Over the time period he studied — from 1949 to 2016 — the average global temperature rose 0.5 degrees Celsius due to climate change.’
- ‘But Kossin also looked at changes in the speeds at which storms moved over land: in the western North Pacific, storms slowed 30% over land, while in the North Atlantic, they slowed by 20%.’
- Mei et al. 15
- We find that upper ocean temperatures in the low-latitude northwestern Pacific (LLNWP) and sea surface temperatures in the central equatorial Pacific control the seasonal average lifetime peak intensity by setting the rate and duration of typhoon intensification, respectively.’
- ‘An anomalously strong LLNWP upper ocean warming has favored increased intensification rates and led to unprecedentedly high average typhoon intensity during the recent global warming hiatus period, despite a reduction in intensification duration tied to the central equatorial Pacific surface cooling. Continued LLNWP upper ocean warming as predicted under a moderate [that is, Representative Concentration Pathway (RCP) 4.5] climate change scenario is expected to further increase the average typhoon intensity by an additional 14% by 2100.’

- Tsuboki et al. 14
Economic Effects
- Oxford Economics 19 (cited)
- ‘In the absence of efforts to curb greenhouse gas emissions, the earth could warm by 2 degrees celsius by 2050, cutting global gross domestic product by 2.5% to 7.5%, Oxford estimates, with the worst affected countries being in Africa and Asia. Longer term, a rise in temperatures of 4 degrees by 2100 could cut output by as much as 30%.’
- The Economist 19 (cited)
- ‘The economy will be 3% smaller in 2050 [as a result of climate change] according to a new framework developed by The Economist Intelligence Unit (The EIU).’
- ‘Our index reveals the vulnerabilities that exist in developing countries to the oncoming impacts of climate change. The impacts of climate change are already being felt – we are already seeing the effects of more extreme weather events –, but the economic impacts will only grow over time. It’s important to remember that a 3% loss of real GDP in 2050 is highly significant for the global economy, and that there will be economic losses in every year of the coming three decades.’
- Martinich et al. 19
- If global temperatures rose 2.8˚ C from pre-industrial levels by 2100, and if they increased by 4.5˚ C. The study projected that if the higher-temperature scenario prevails, climate change impacts on these 22 sectors could cost the U.S. $520 billion each year. If we can keep to 2.8˚ C, it would cost $224 billion less.
- Hsiang et al. 17
- ‘The combined value of market and nonmarket damage across analyzed sectors—agriculture, crime, coastal storms, energy, human mortality, and labor—increases quadratically in global mean temperature, costing roughly 1.2% of gross domestic product per +1°C on average. Importantly, risk is distributed unequally across locations, generating a large transfer of value northward and westward that increases economic inequality. By the late 21st century, the poorest third of counties are projected to experience damages between 2 and 20% of county income (90% chance) under business-as-usual emissions’
- Estrada et al. 15
- ‘We identify an upward trend in economic losses between 1900 and 2005 that cannot be explained by commonly used socioeconomic variables. Based on records of geophysical data, we identify an upward trend in both the number and intensity of hurricanes in the North Atlantic basin as well as in the number of loss-generating tropical cyclone records in the United States that is consistent with the smoothed global average rise in surface air temperature. We estimate that, in 2005, US$2 to US$14 billion of the recorded annual losses could be attributable to climate change, 2 to 12% of that year’s normalized losses’
- Khan et al. 19
- ‘Our counterfactual analysis suggests that a persistent increase in average global temperature by 0.04°C per year, in the absence of mitigation policies, reduces world real GDP per capita by 7.22 percent by 2100. On the other hand, abiding by the Paris Agreement, thereby limiting the temperature increase to 0.01°C per annum, reduces the loss substantially to 1.07 percent. These effects vary significantly across countries.’
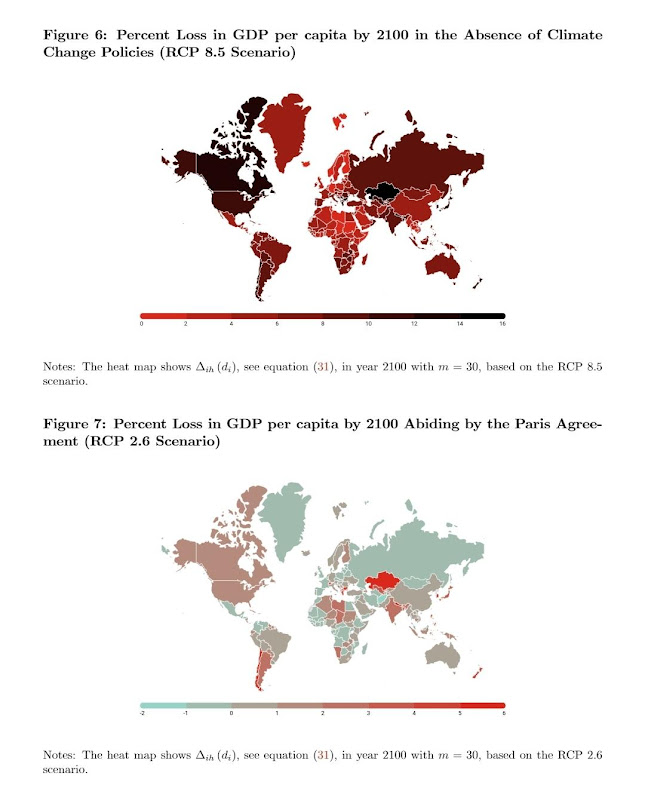
- ‘Our counterfactual analysis suggests that a persistent increase in average global temperature by 0.04°C per year, in the absence of mitigation policies, reduces world real GDP per capita by 7.22 percent by 2100. On the other hand, abiding by the Paris Agreement, thereby limiting the temperature increase to 0.01°C per annum, reduces the loss substantially to 1.07 percent. These effects vary significantly across countries.’
- Calel et al. 20
- Suggests we could be underestimating the financial impact of climate change by trillions of dollars
Anthropogenic Consensus
` `Anthropogenic Consensus
The near totality of available scientific knowledge verifies the link between rising CO2 and observations of climate change
- Hansen & Stone 16
- Study providing a “systematic assessment of the role of anthropogenic climate change for the range of impacts of regional climate trends reported in the IPCC’s Fifth Assessment Report”
- Finds that “almost two-thirds of the impacts related to atmospheric and ocean temperature can be confidently attributed to anthropogenic forcing” and that “anthropogenic climate change has been a major influence for approximately three-quarters of the impacts observed on continental scales”
- This is based on the methodology of finding “human fingerprints” in atmospheric CO2 measurements through the density of the atoms in the carbon (813C) which can distinguish between naturally derived and anthropogenically (human) derived sources of CO2 emissions. The more negative the 813C, the higher the proportion of carbon that comes from fossil fuel emissions. In this, it is possible to know that the emission of fossil fuels is the greatest cause of CO2 emissions since before the Industrial Revolution. (Another source on this)
- Maibach et al. 14
- The Greenhouse Effect: CO2 absorbs infrared radiation and then re-radiates it back toward the surface of the planet.
- Scientific consensus verifies human-caused climate change
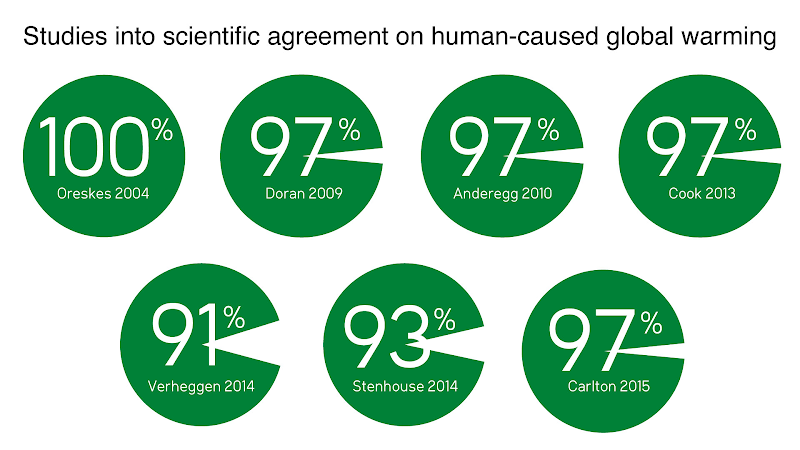
- More than 97% of climate experts (usually specified as those who publish primarily on climate change in the peer-reviewed scientific literature) are convinced that human‐caused climate change is happening
- Here are some additional studies that verify the scientific consensus on anthropogenic climate change:
- Anderegg 10: 97-98%
- “we use an extensive dataset of 1,372 climate researchers and their publication and citation data to show that (i) 97–98% of the climate researchers most actively publishing in the field surveyed here support the tenets of ACC outlined by the Intergovernmental Panel on Climate Change, and (ii) the relative climate expertise and scientific prominence of the researchers unconvinced of ACC are substantially below that of the convinced researchers.” — this means more experience = greater endorsement of consensus
- Cook et al. 13: 97%
- “Among abstracts expressing a position on AGW, 97.1% endorsed the consensus position that humans are causing global warming… Among self-rated papers expressing a position on AGW, 97.2% endorsed the consensus.”
- Powell 19: 100%
- reviewed 11,602 peer-reviewed articles on “climate change” and “global warming” published in 2019
- Graphic by skepticalscience
- Anderegg 10: 97-98%
- Among scientific organizations:
Air Pollution
Air Pollution
Air pollution, primarily caused by the same energy emission that harms the climate, has detrimental effects on public health, including premature death, lung disease, and cancer.
- World Health Organization - Air Pollution Impacts
- Air pollution kills an estimated 7 million people worldwide every year (Millions in Asia and hundreds of thousands in Europe & the Americas)
- 9 out of 10 people breathe air containing high levels of pollutants.
- 97% of cities in low- and middle- income countries with more than 100,000 inhabitants do not meet WHO air quality guidelines.
- 43% of all lung disease and lung cancer deaths are attributable to air pollution. Air pollution causes 1.8 million deaths due to lung disease and cancer every year.
- As air quality declines, the risk of stroke, heart disease, lung cancer, and chronic and acute respiratory diseases, including asthma, increases.
- World Health Organization - Air Pollution Causes
- Major outdoor pollution sources include vehicles, power generation, building heating systems, agriculture/waste incineration and industry.
- More than 3 billion people worldwide rely on polluting technologies and fuels
- Air quality is closely linked to earth’s climate and ecosystems globally. Many of the drivers of air pollution (i.e. combustion of fossil fuels) are also sources of high CO2 emissions.
- Some air pollutants such as ozone and black carbon are short-lived climate pollutants that greatly contribute to climate change and affect agricultural productivity.
Climate Denialism - Analysis
Climate Denialism - Analysis
For debunks of common false claims, check out this section instead.
- Petersen et al. 19
- Study that extensively examines the permeation of climate contrarian influence throughout media
- “Contrarians are featured in 49% more media articles than scientists.”
- “When comparing visibility in mainstream media sources only, we observe just a 1% excess visibility, which objectively demonstrates the crowding out of professional sources by the proliferation of new media sources, many of which contribute to the production and consumption of climate change disinformation at scale.”
- Benestad et al. 16
- Examines a selection of 38 papers which dispute anthropogenic climate change
- Found that these papers oftentimes had mistakes in methodology, analysis, assumptions, etc.
- “In many cases, shortcomings are due to insufficient model evaluation, leading to results that are not universally valid but rather are an artifact of a particular experimental setup. Other typical weaknesses include false dichotomies, inappropriate statistical methods, or basing conclusions on misconceived or incomplete physics.”
- The Guardian: Goldenberg 12
- Libertarian think tank keeps prominent sceptics on its payroll and relies on millions in funding from carbon industry
- Scheme includes $100,000 for spreading the message in K-12 schools that “the topic of climate change is controversial and uncertain”’
- Not the most reliable information to tackle the issue of climate change misinformation: “It was not possible to immediately verify the authenticity of the documents”
- Scientific American: Fischer 13
- Most donations to climate denial efforts are of dark money, meaning that they can’t be traced back to their original donors
- “In all, 140 foundations funneled $558 million to almost 100 climate denial organizations from 2003 to 2010. Meanwhile the traceable cash flow from more traditional sources, such as Koch Industries and ExxonMobil, has disappeared.”
Climate Denialism - Rebuttals
Climate Denialism - Rebuttals
https://rationalwiki.org/wiki/Global_warming
https://skepticalscience.com//argument.php
https://www.youtube.com/watch?v=FBF6F4Bi6Sg
https://grist.org/climate/skeptics-2/
- Zwally et al. 15 (usually cited as this NASA page)
- Cited to claim that Antarctic ice is actually growing
- Hbomberguy does a good response to this (5:37)
- Washington Post article outlining problems
- Big Think article outlining problems
- Scientific American article outlining problems
- Forbes article outlining problems
- National Geographic article outlining problems
- Carbon Brief article outlining problems
- Aljazeera article outlining problems
- Science Mag article outlining problems
- The key criticisms are:
- Methodological concerns - The study uses a method that is to do with overall change in height, which has been seen as flawed. From the Scientific American article: ‘To translate the change in height (and therefore volume) into a change in mass, scientists must assume a certain density. The question is: Just what is rising? Is it snow or ice? Zwally contends it is ice, and argues that at the end of the last ice age, roughly 10,000 years ago, the amount of snowfall doubled. This would mean that it has been compacting into solid ice for millennia and continues to do so today. Most other scientists, however, do not agree that this is still going on now and argue that any increase in the ice sheet’s height is from added snowfall alone. In this case, the density of snow would be the right number to use.’
- Statistical outlier - This seems to be contrary to what most studies show. I suggest having a look at this study, this study and this study, plus a whole host more if you look through the articles I linked up above.
- Read the study - It actually shows the amount of ice being gained is slowing down over the years, which should prove that even if this data is correct, it still shows evidence of climate change’s impact. From the NASA article: ‘According to the new analysis of satellite data, the Antarctic ice sheet showed a net gain of 112 billion tons of ice a year from 1992 to 2001. That net gain slowed to 82 billion tons of ice per year between 2003 and 2008.’
- Without context - Even if the findings are true, the amount of ice lost in Greenland far outweighs any gain in Antarctica. According to this study, the amount of annual ice lost in Greenland went from 25 billion to 234 billion tons from 1992 to 2018, showing an upward trend in the amount of ice lost, while in the NASA study, they show a downward trend of the amount of ice gained in Antarctica. In fact, the head author himself also says climate change is a problem that must be dealt with. From the Scientific American article: ‘Zwally notes that he was vigilant about this in 2015. “When our paper came out, I was very careful to emphasize that this is in no way contradictory to the findings of the IPCC report or conclusions that climate change is a serious problem that we need to do something about,” he says.’
- Associated Press article from 1989

- Article from the Associated Press from 1989 that people use to show that ‘alarmist’ predictions have been wrong
- First of all, a misleading headline. The UN did not say this, this was a person who works for the UN.**
- The person interviewed is not a climate scientist
- According to Snopes, his statement was nations would be under water at some time in the more distant future, not the way it is usually interpreted, which is ‘this guy believes nations would be underwater in 10 years,’ and the scenarios were looking all the way into 2100. What he was saying was that we had 10 years to reverse the effects of climate change before the effects become out of human control.
- By whole nations, Brown probably meant nations in the Pacific like Kiribati, Tuvalu, the Marshall Islands, and more, which all, among others, may potentially be underwater in the next 50 years according to a UN report
- Plus, contrary to popular belief, climate models even going back to the 70s have been very accurate to observations
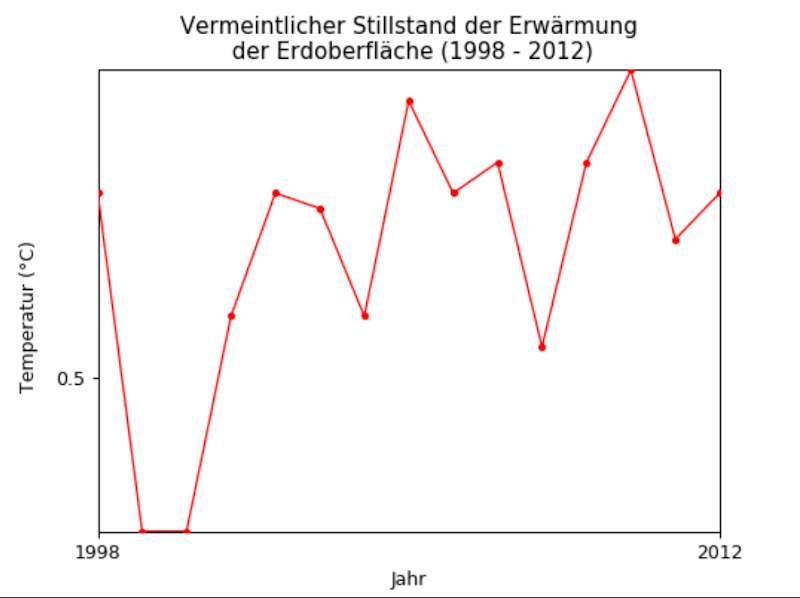
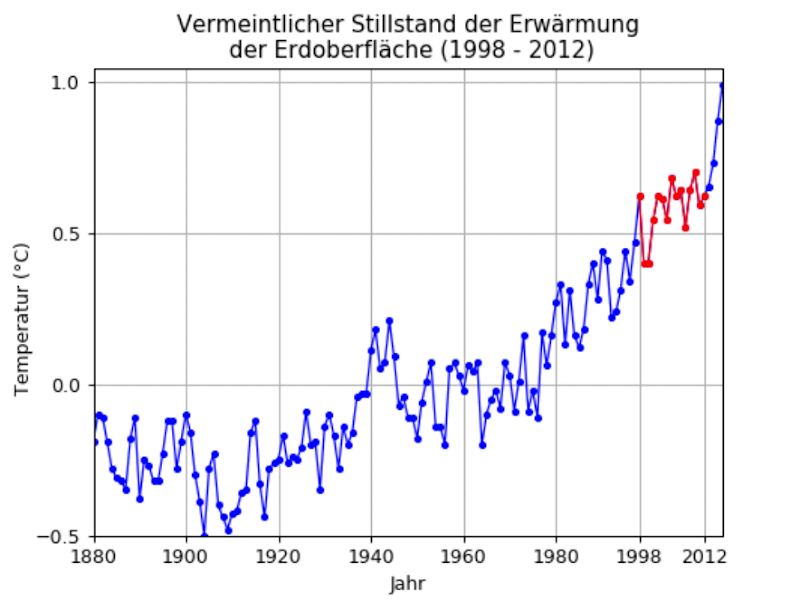
- Very often referenced graph on the left, trying to claim that there hasn’t been warming between 1998 and 2012, but the one on the right shows the trend before and after the referenced time frame, with a very obvious upward trend.
 |
 |
|---|---|
| Graph often cited by global warming deniers to argue there is no warming trend | The same graph but given more years, revealing the long-term warming trend |
-
Good explanation into what happened in this Wikipedia article
- But 30,000 scientists signed a petition to say climate change isn’t real!
- According to their own website, only 3,805 of those signatures work in ‘Atmosphere, Earth, & Environment,’ only around 12% of all signatories.
- In fact, people that work in medicine (3,046) are almost as high a number as people who work in some sort of climate science!
- That means I could be a doctor or a programmer (medical and computing science degrees are included, two very unrelated fields to climate science) and without professionally knowing anything about climate change, I can sign this petition
- And again, these people do not represent the consensus (go to Climate and Pollution > Anthropogenic Consensus)
- When Scientific American tried to reach out to 30 random signatories, this is what happened: ‘Of the 26 we were able to identify in various databases, 11 said they still agreed with the petition—one was an active climate researcher, two others had relevant expertise, and eight signed based on an informal evaluation. Six said they would not sign the petition today, three did not remember any such petition, one had died, and five did not answer repeated messages.’
- But what about Climategate?
- Climategate was the leak of emails and computer files from climate researchers at the University of East Anglia in the UK, and many claimed it proved that climate change was a hoax, as the department at the university is one of the country’s leaders in climate research.
- People claim the contents of these emails showed that the scientists had manipulated data. However, FactCheck.org’s analysis found that climate deniers misrepresented contents of the emails
- The House of Commons’ Science and Technology Committee and an independent report both found no systematic evidence of manipulated data from the university.
- There was a survey of meteorologists that showed only 52% believe in man made climate change!
- For context, this was a study that surveyed members of the American Meteorological Society.
- First of all, almost half have never published in climate science (out of 1821 people, 800 are classified as non publishing).
- And those who actually specialise or research in climate science are much more likely to believe in man made climate change. 73% who publish most of their work in climate science agree with man made climate change (rises to 78% with just climate scientists), compared to 62% who mostly publish in other fields (rises to 71% with just climate scientists), and 37% who have not published in climate science (about the same level with just climate scientists).
- And for those who said there was insufficient evidence (20% of the total sample), they still lean much more towards man made than not man made, 11% of the total sample.
- This hypothesis that people who have much more experience with climate science is quite consistent with other studies. People who know more about expert consensus are much more likely to believe in climate change and support activism against it. And another survey of scientists found this response to the question ‘Do you think human activity is a significant contributing factor in changing mean global temperatures?’:

- Though it is true that even 73% is a bit low (but way higher than 52%), it is a statistical outlier and a cherry picked study compared to the mountain of evidence showing much higher consensus (go to Climate and Pollution > Anthropogenic Consensus)
- The American Meteorological Society accepts the consensus.
- The authors of the study have criticised interpretations of the study to promote climate denialism.
- Read more on The Guardian and Media Matters
- Hang on, the Earth’s temperature has gone up and down many times in history, surely it’s all just natural!
- What happened in the past is called Milankovitch Cycles (NASA article that explains it better), where some variations happen in the Earth’s tilt and position relative to the sun.
- Three main things happen during this time:

- Obliquity is the most significant factor in this. Its tilt creates a slight heating of the planet, which in turn releases CO2 from the ocean, which then increases temperature even more, and creates a positive feedback loop. This is evident in the fact that CO2 historically lags behind (but is very closely correlated to) temperature.
- But the climate crisis today cannot be explained by that. For starters, interglacial periods (which is when it reaches the spikes in hottest temperature) caused by Milankovitch Cycles took thousands of years to go from the glacial period (when it is at a stable temperature) to the peak of an interglacial period What we are seeing right now is happening in about 200 years. One study found that climate change is occurring ten times faster than at any time in the past 65 million years.
- The obliquity is actually moving inwards.The Earth’s obliquity hit 24.5° in 8,700 BCE, which means the tilt is going in towards the North Pole. We are currently at 23.44°.
- Did Benny Peiser not debunk Oreskes 2004, which claimed absolutely no contradicting papers to the scientific consensus?
- Peiser himself went on to say that his debunk was flawed:
- ‘Some of the abstracts that I included in the 34 “reject or doubt” category are very ambiguous and should not have been included.’
- In fact, most studies that Peiser claimed rejected the consensus did not actually reject it.
- ‘Only [a] few abstracts explicitly reject or doubt the AGW (anthropogenic global warming) consensus which is why I have publicly withdrawn this point of my critique.’
- And those that did reject the consensus were editorials or letters, not peer reviewed studies
- His study basically strengthened consensus, by not being able to properly find a study that disputed the consensus.
- More here.
Famous Climate Deniers
- Bjørn Lomborg
- https://climate.anu.edu.au/news-events/news/controversial-commentator-bjorn-lomborgs-bushfire-claim-debunked
- https://www.theguardian.com/environment/2017/may/21/experts-reject-bjorn-lomborg-centres-view-that-2c-warming-target-not-worth-it
- http://www.realclimate.org/index.php/archives/2015/08/bjorn-lomborg-just-a-scientist-with-a-different-opinion/
- https://archive.thinkprogress.org/climate-science-rapid-response-team-debunks-bjorn-lomborgs-washington-post-op-ed-51b0d338f076/
- https://www.newsweek.com/debunking-lomborg-climate-change-skeptic-75173
- https://www.theguardian.com/commentisfree/cif-green/2010/aug/30/lombard-missing-questions-climate-change
- https://www.lse.ac.uk/granthaminstitute/news/bjorn-lomborgs-lukewarmer-misinformation-about-climate-change-and-poverty/
- Patrick Moore
- https://www.snopes.com/fact-check/patrick-moore-climate-doubter/
- https://www.skepticalscience.com/moore-2012.html
- https://www.theguardian.com/environment/planet-oz/2015/apr/16/ask-the-real-experts-about-ocean-acidification-not-climate-science-deniers
- https://www.greenpeace.org/usa/news/greenpeace-statement-on-patric/
- Richard Lindzen
- Alex Epstein
- Steven Milloy
Additional Resources
Additional Resources
-
Main Wikipedia article about global warming
-
Has been thoroughly developed and reviewed, having been given featured article status (meaning that Wikipedians have found it to be one of the best articles the website has to offer)
-
Has loads and loads of highly reliable sources, see the “Sources” section of the article
-
- Global Warming & Climate Change Myths
- Debunks ~200 climate change denial myths
- Climate Change FAQ - NASA
- Concisely answers common questions about climate change
